How fast is the average online shop and does your site really need Shopify speed optimization?
We analyzed 400 Shopify stores to see just how fast the average store is. Then we compared them against top e-commerce sites to see whether you need to optimize your Shopify store's speed.
Why do I even need a fast site?
Building a fast web and mobile experience is essential, especially for e-commerce stores where better performance can directly drive sales and conversions.
Just how important is having a fast store?
- In 2016, AliExpress made their site faster by a third and received 10.5% more orders
- In 2008, Amazon found that every 100ms of latency cost them 1% in sales.
- Akamai research shows a 1 second delay in page response can result in a 7% reduction in conversions.
How fast is your Shopify store?
Compare how fast your store is to a huge sample of other stores. Get benchmarked and find out where you can improve your speed to make more sales.

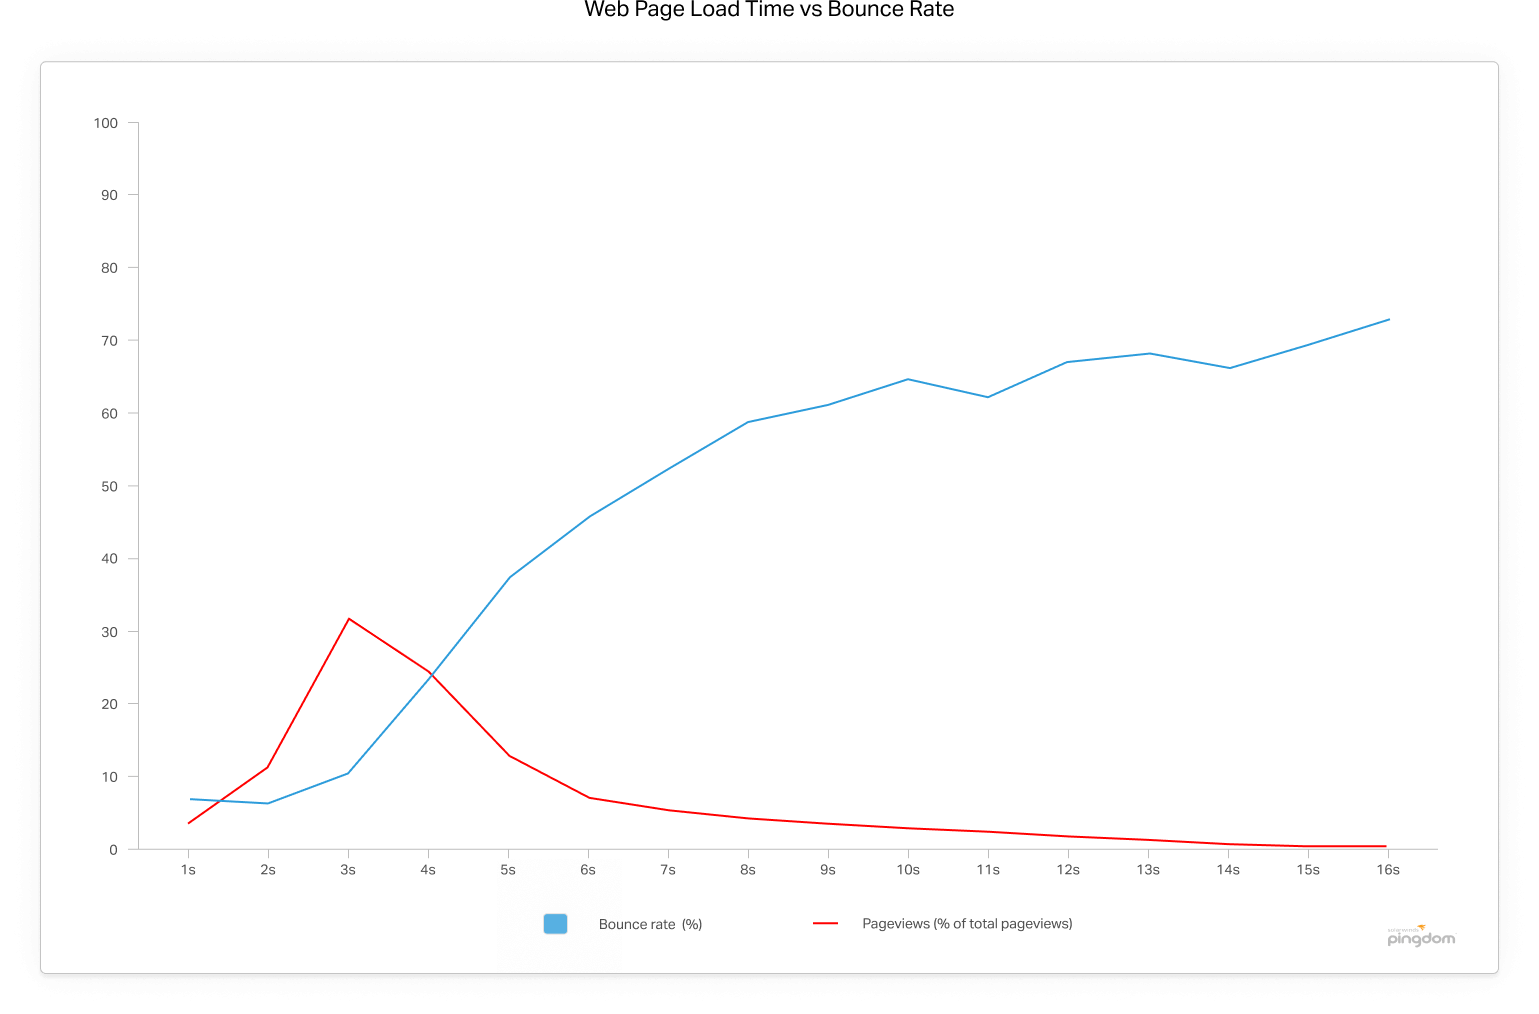
The chart above shows how often visitors leave without visiting another page (the bounce rate) in relation to site speeds. The bounce rate starts soaring after the site takes 3 seconds to load, reaching a rate of 38% by the time the site takes 5 seconds to load!
Customers have low attention spans and would rather leave than wait for a slow page to load. Unfortunately, high performance is an area that doesn't get its share of love compared to more sexy features like eye popping themes and email collection spinners.
Let's say you're on a 2gb data plan, and you clicked on an Instagram ad for a discount Lebron James jersey. But the page is a whopping 9mb and still hasn't loaded after 5 seconds. It doesn't matter that Ashlie from Alabama bought it 7 minutes ago, life is too short to wait for a website to load. You close the tab.
How fast is the average Shopify store?
First, to define page speed we'll need to define our performance metrics. What does "fast" mean? Page load time alone doesn't tell the full story.
A website that loads quickly but doesn't react to user input is worse than a larger page which uses skeleton screens and has better perceived load times. To measure web performance, we will use user centric performance metrics as follows:
| Metric | Description | |
|---|---|---|
| First contentful Paint | Is it happening? When the browser renders the first bit of content. This content differs from the previous page and tells the user that the website isn't hanging. |  |
| First meaningful Paint | Is it useful? When the important parts of the page load. The user can engage with the content and can start consuming it. |  |
| Time to Interactive (TTI) | It is usable? When the page’s initial javascript is fully loaded, and the page can reliably respond to user input. |  |
Performance Results
We ran our tests by simulating a 3G network on mobile devices to see more variation in load times. Absolute numbers will vary across devices and networks.
To create a base to compare speeds against, we tested our sample of Shopify stores against 3 of the top grossing e-commerce stores: Amazon, Walmart, and Ebay.
These companies spend countless engineering hours on performance and provide a baseline of what page speeds are expected.
First Contentful paint
| Shopify Median | 4.4s |
| Amazon | 2.6s (8.5th percentile) |
| Walmart | 2.5s (5.8th percentile) |
| Ebay | 2.4s (2.4th percentile) |
First Meaningful Paint
| Shopify Median | 4.9s |
| Amazon | 3.6s (23rd percentile) |
| Walmart | 3.2s (14th percentile) |
| Ebay | 2.7s (5.8th percentile) |
Time to Interactive
| Shopify Median | 22s |
| Amazon | 12s (14rd percentile) |
| Walmart | 20s (42th percentile) |
| Ebay | 9.5s (9th percentile) |
All major e-commerce retailers have better scores than Shopify across all metrics.
One heavily optimized metric is first contentful paint, which is 90% faster than all Shopify stores for Amazon, Walmart and Ebay.
The three e-commerce behemoths took 2.6s, 2.5s, and 2.4s to display the first bit of content. That's much faster than the 4.4s for the average Shopify store.
First contentful paint is an especially important metric to optimize as it tells the user that the page is indeed loading. After this first snippet of content, loading indicators or skeleton content will improve perceived load times.
Making things blazing fast
What are the major errors that e-commerce websites make and how can they make their sites load faster?
The following is a ranked list of the top eight performance culprits. We've also added in some tips for improvements to make your e-commerce site as fast as possible.
8. Animated Content
| Stat | Savings (kb) |
|---|---|
| Mean | 114.6 kb |
| Median | 0 kb |
| 75th percentile | 0 kb |
| 90th percentile | 0 kb |
Animated content with GIFs are huge! Only 8% of shops use animated content, but the ones that do can save an average of 1mb by converting GIFs to WebP or by using more lightweight video formats. On average, stores with animated content can save 26% by converting GIFs to WebP.
7. Unminified CSS
| Stat | Savings (kb) |
|---|---|
| Mean | 2.8 kb |
| Median | 0 kb |
| 75th percentile | 3.7 kb |
| 90th percentile | 9.0 kb |
Minification is one of the main methods to reduce bandwidth load times and bandwidth. Shopify does a good job with minification, as 66% of stores already have minified CSS.
The rest of the stores can save a median of 5.7KB by minifying their CSS. Shopify supports using liquid asset tags to minify your javascript and CSS assets.
6. Unminified Javascript
| Stat | Savings (kb) |
|---|---|
| Mean | 29.7 kb |
| Median | 11.9 kb |
| 75th percentile | 38.3 kb |
| 90th percentile | 63.1 kb |
Minifying javascript reduces payload sizes and script parse time. Top Shopify stores have a median of 12KB of unminified javascript, with a 75 percentile of 40KB. This is slightly worse than the average unminified CSS sizes that we've seen.
5. Unused CSS
| Stat | Savings (kb) |
|---|---|
| Mean | 132.2 kb |
| Median | 88.6 kb |
| 75th percentile | 166.5 kb |
| 90th percentile | 303.4 kb |
96% of Shopify stores have unused CSS, with a median of 88.6kb of potential savings. Make sure unused CSS files are removed from your script tags.
4. Responsive Images
| Stat | Savings (kb) |
|---|---|
| Mean | 529.9 kb |
| Median | 17.3 kb |
| 75th percentile | 312.1 kb |
| 90th percentile | 1095.8 kb |
If a desktop sized image is shown on a mobile device, the user is downloading more image data than they need. As a result, their cell plans are gobbled up.
Shops can serve different image sizes to each device to reduce bandwidth on mobile devices.
Fortunately, 38.6% of stores have newer themes that serve responsive images. The other 71.4% of shops can save 211kb by loading appropriately sized images for each screen resolution.
3. Next-gen image formats
| Stat | Savings (kb) |
|---|---|
| Mean | 1209.09 kb |
| Median | 283.96 kb |
| 75th percentile | 912.38 kb |
| 90th percentile | 2745.79 kb |
Stores can save a median of 283kb using image formats with superior image compression like WebP. Facebook experienced 25-35% file size savings for JPEGs, and 80% savings for PNGs after switching to WebP.
The WebP file format is supported in Chrome and Opera and provides better lossy and lossless compression for images on the web.
Although not all browsers support this, older browsers can use other formats like JPEG 2000 and JPEG XR or fallback to PNG or JPEG.
2. Offscreen Images
| Stat | Savings (kb) |
|---|---|
| Mean | 2067.4 kb |
| Median | 819.1 kb |
| 75th percentile | 2186.4 kb |
| 90th percentile | 4090.6 kb |
Offscreen images are images below the fold, which users don't see until they scroll down. This is the largest source of wasted resources downloaded, accounting for a median of 819kb.
Websites can save bandwidth by only loading downloading above the fold images during the initial request, and below the fold images when the user scrolls down.
1. Render Blocking Resources
| Stat | Savings (ms) |
|---|---|
| Mean | 1482.4 ms |
| Median | 1230.5 ms |
| 75th percentile | 2093.2 ms |
| 90th percentile | 2980.0 ms |
Render blocking resources are CSS and javascript assets that block the loading of the web page. The browser executes stylesheets, synchronous scripts and imports in the head tag before rendering any HTML content.
The average Shopify store can shave 1230ms off rendering times by removing or deferring render blocking resources.
Every byte matters!
The average store can save 1.2mb of space, and the 25% worst performers can save at least 2.8mb per page.
With an average data plan of 2gb, that's a lot of saved bandwidth! The most impactful improvement is to remove render blocking resources, because they directly impact first contentful paint, a metric heavily optimized by top e-commerce websites.
Do I need Shopify speed optimization?
To figure this out, just run an audit for your own shop using our benchmarking tool.
This will highlight the most important performance issues for your website so you see how your theme file and images stack up. You'll probably find some low hanging fruit that you can fix for immediate speed gains.
How fast is your Shopify store?
Compare how fast your store is to a huge sample of other stores. Get benchmarked and find out where you can improve your speed to make more sales.
Make sure your theme and third party apps use proper minification, and use responsive image loading. It’s also important to measure, monitor and refine performance continually.
Need help?
If you’d like us to optimize your shop, we're happy to help! To combat these issues, we're building a product called Hyperspeed. Hyperspeed optimizes your store for each of these dimensions. You can signup for early access to Hyperspeed now.n


