Understanding Shopify Speed Performance Metrics
Tracking website performance metrics is essential for optimizing your site or Shopify store, but with so many metrics available, it can be overwhelming to decide which ones matter most.
The right Shopify speed performance metrics depend on your specific goals, what you’re trying to improve, and the tools you have access to.
The challenge arises from the overwhelming amount of data available on platforms like Google Analytics for most websites or the Shopify Performance Dashboard for e-commerce stores.
With metrics ranging from bounce rates to page views, it can be difficult to determine which ones are key to evaluating your site’s performance.
To make matters more complicated, not all metrics hold long-term value—some may seem important at first but don’t contribute significantly to your overall goals.
In short, not all metrics are created equal.
It’s important to focus on the ones that align with your business objectives and contribute to improving user experience, conversion rates, and SEO performance.
Why Monitoring Speed Performance Metrics is Crucial
Monitoring website performance metrics is crucial because they directly impact the user experience.
A fast, smooth, and stable website retains users longer, reduces bounce rates, and improves conversion rates.
On the other hand, a slow or unstable site can frustrate visitors, causing them to leave before engaging with the content.
What are the Core Web Vitals?
Core Web Vitals are a set of metrics that measure real-world user experience by focusing on three critical aspects of webpage performance: loading speed, interactivity, and visual stability. Specifically, Largest Contentful Paint (LCP), Interaction to Next Paint (INP), and Cumulative Layout Shift (CLS) are used to evaluate how well a Shopify store or website performs.
These metrics provide insight into how fast the site loads, how quickly users can interact with it, and how stable the layout remains during loading, all of which directly impact user satisfaction and search engine rankings.
Understanding and optimising these metrics is crucial for maintaining a high-performing, user-friendly website.
Interaction to Next Paint (INP)

Interaction to Next Paint (INP) – Shopify Speed Performance Metrics
Interaction to Next Paint (INP) measures a page’s overall responsiveness by observing the latency of all user interactions, such as clicks, taps, and key presses, during the user’s session.
What’s in an interaction?
- Clicking a mouse
- Tapping a touchscreen device
- Pressing keys on a physical or on-screen keyboard
A Good INP score:
- INP ≤ 200 milliseconds: The page has excellent responsiveness.
- INP between 200 and 500 milliseconds: Responsiveness needs improvement.
- INP > 500 milliseconds: The page has poor responsiveness, leading to noticeable delays in user interactions.
Largest Contentful Paint (LCP)

Largest Contentful Paint (LCP) – Shopify Speed Performance Metrics
LCP measures the time it takes to load the largest visual element on a webpage, such as a hero image, banner, or heading.
Google’s Core Web Vitals places significant emphasis on LCP because it directly affects how fast a page feels to users.
Factors Affecting LCP and How to optimize It
LCP can be slowed down by factors such as large images, slow server response times, and inefficient client-side rendering.
As a general guideline, a web page should render its largest elements within 2.5 seconds to ensure a good user experience.
- Good Performance: An LCP score of 1.2 seconds or less indicates strong performance, and no further optimization is necessary.
- Needs Improvement: If your LCP score is between 1.2 and 2.5 seconds, it’s acceptable but could be improved by tweaking specific elements.
- Poor Performance: An LCP score over 2.5 seconds signals poor performance, which can negatively impact user experience and hinder site growth. In this case, further optimizations are crucial to enhancing speed and usability.
To optimize LCP, consider reducing image sizes, using more efficient loading techniques like lazy loading, and minimising render-blocking resources like JavaScript and CSS.
Cumulative Layout Shift (CLS)

Cumulative Layout Shift (CLS) – Shopify Speed Performance Metrics
CLS measures how much the layout of a page shifts as it loads. Layout shifts occur when visible elements move unexpectedly, which can cause users to click on the wrong elements or lose their place on the page.
CLS and How to Reduce It
Common examples of layout shifts include text moving when an image loads or buttons shifting when an ad loads above the content.
A web page with strong visual stability will have a CLS score of below 0.1, indicating minimal unexpected layout shifts. Any score above 0.25 suggests poor performance, which can negatively affect user experience by causing disruptive visual changes during page load.
To reduce CLS, use size attributes for media like images and videos, and avoid placing new content above existing elements as the page loads.
Time to First Byte (TTFB)

Time To First Byte (TTFB) – Shopify Speed Performance Metrics
TTFB measures the time it takes for a user’s browser to receive the first byte of data from the server after a request is made.
It reflects how responsive the server is and how efficiently content is being delivered.
A Good TTFB
A slow TTFB can extend the entire loading process, causing frustration for users.
While there isn’t a universal benchmark, aiming for 0.8 seconds is a solid goal for optimal performance. Here’s why:
User experience studies show that delays beyond 1 second negatively impact engagement and conversion rates. Keeping TTFB at or below 0.8 seconds ensures a smooth, responsive experience.
Performance Breakdown:
- Poor (>1.8 seconds): Indicates major issues. Users will likely face laggy interactions, increasing frustration and abandonment.
- Room for Improvement (0.8–1.8 seconds): Not terrible, but optimizing here can further enhance user experience, especially for those with slower connections.
First Contentful Paint (FCP)

First Contentful Paint (FCP) – Shopify Speed Performance Metrics
FCP measures the time it takes for the first visual element—whether it’s text, images, or other content—to appear on the screen. This metric provides feedback to the user that the page is loading, which helps reduce abandonment rates.
An Ideal FCP
To stay in the green zone, aim for a FCP of 1.8 seconds or less. To ensure you’re meeting this target for most users, it’s recommended to measure the 75th percentile of page loads, segmented by mobile and desktop devices.
This approach helps capture a more accurate picture of your site’s performance across different user experiences.
Even if the rest of the page isn’t fully loaded, displaying content quickly helps improve user satisfaction.
Speed Index
Speed Index measures how quickly the visible parts of a webpage are displayed during the loading process.
It provides a more comprehensive view of overall page performance compared to individual metrics like LCP or FCP.
How Speed Index Differs from Other Metrics Like LCP and FCP
While LCP and FCP focus on specific content elements, Speed Index evaluates the entire visual experience.
A lower Speed Index score indicates that the page loads its visible content faster and provides a smoother, more continuous experience for users.
How fast is your Shopify store?
Compare how fast your store is to a huge sample of other stores. Get benchmarked and find out where you can improve your speed to make more sales.
Best Practices for Optimising Page Speed Performance
Improving website performance is essential for enhancing user experience, increasing conversions, and achieving higher search engine rankings.
By following best practices and focusing on key areas of optimization, you can significantly boost your store’s speed and overall performance.
Here are the most effective strategies:
Reduce third-party apps and remove unused scripts
Third-party apps often add extra scripts to your Shopify store, which can slow down load times.
Each app typically loads its own JavaScript and CSS, increasing the number of HTTP requests and the overall page size. Reducing the number of apps or disabling unused ones helps streamline your website’s performance.
Additionally, removing any unused or unnecessary scripts left behind by uninstalled apps can reduce page bloat and improve load times. Regularly audit your apps and scripts to ensure that only essential ones remain active.
Balance the image elements across all pages
Heavy image files are one of the leading causes of slow website performance.
Balancing image usage across all pages ensures that no single page is overloaded with large image files that can impact load speed. Use compressed images and ensure each image is optimized for web viewing without sacrificing quality.
A balanced approach to image distribution helps maintain fast load times throughout the entire Shopify store, providing a consistent user experience.
Use static images for the hero banner
Hero banners are often large and visually prominent, making them one of the heaviest elements on the page.
By using static images instead of animated or video banners, you can significantly reduce the page’s load time. Static images load faster, are easier to optimize, and consume less bandwidth, ensuring a smoother and more responsive user experience.
Additionally, properly optimising and compressing these static hero images will further improve loading speed.
Check out The Ultimate Guide to Shopify Speed Optimization to learn more speed hacks.
How Does Hyperspeed Improve Speed Performance Metrics?
Hyperspeed optimizes key performance metrics through several advanced techniques, each specifically designed to improve load time, interactivity, and overall user experience for Shopify stores.
Here’s how Hyperspeed tackles each metric:
Image optimization

6 Shopify Speed Performance Metrics You Need to Know
Images are often the heaviest elements on a webpage, and Hyperspeed uses responsive image sizes and image compression to significantly reduce load times.
The tool ensures that the smallest necessary image is served for each device, which helps to reduce Largest Contentful Paint (LCP) times by compressing image files without noticeable loss of quality.
For example, it can compress images by up to 56%, reducing the burden on the server while maintaining visual quality.
Lazy Loading

6 Shopify Speed Performance Metrics You Need to Know
Lazy Loading is a technique where images and videos are only loaded as the user scrolls down the page, improving the First Contentful Paint (FCP) by avoiding the immediate download of off-screen elements.
This approach reduces initial load times, leading to faster perceived speeds and better engagement rates. Lazy Loading also plays a critical role in Speed Index and overall page load time.
Code Minification and Compression

6 Shopify Speed Performance Metrics You Need to Know
Hyperspeed minifies JavaScript (JS) and CSS files, removing unnecessary characters and whitespace to shrink file sizes.
This optimization speeds up both Largest Contentful Paint (LCP) and First Input Delay (FID) by enabling the browser to render the page faster, ensuring that key scripts load without unnecessary delays.
Critical CSS and JavaScript Deferral
Hyperspeed optimizes the loading of essential styling and scripts by implementing Critical CSS extraction and Smart JavaScript Deferral.
Critical CSS ensures that the most important styles load first, improving First Contentful Paint (FCP) and Cumulative Layout Shift (CLS).
Meanwhile, JavaScript deferral delays non-essential scripts until user interaction begins, which significantly improves both First Input Delay (FID) and overall user experience.
Preloading Key Elements
Hyperspeed also preloads Largest Contentful Paint (LCP) images, ensuring that the largest and most prominent image on the page loads early.
This proactive optimization minimises load times for key visual elements, improving user engagement by reducing the time it takes for content to appear.
Through these optimizations, Hyperspeed ensures that your Shopify store not only meets but exceeds the performance benchmarks set by Google’s Core Web Vitals, enhancing both user experience and search engine rankings.
By continuously monitoring and adjusting these metrics, Hyperspeed ensures long-term performance gains, making it an essential tool for optimizing Shopify stores
Hyperspeed’s Recommendations for Continuous Shopify Store Improvement
Website performance optimization is not a one-time effort.
To ensure your site stays fast, responsive, and reliable, continuous monitoring and improvement are necessary, especially as new content is added and user behaviours evolve.
Keeping track of key metrics like the Core Web Vitals ensures that your site consistently delivers a great user experience and ranks well in search engines.
How to Implement Continuous Monitoring and Improvement?
- Automated Performance Monitoring: Set up automated tools like Google Search Console to monitor performance metrics in real time. These tools provide alerts and insights when performance thresholds are exceeded, ensuring that any issues are addressed promptly.
- Regular Website Audits: Perform frequent audits of your website’s performance, particularly after implementing updates or changes. Regular audits help identify new optimization opportunities and ensure that your site remains fast and efficient.
- Integrate Performance Optimization into Development: Make performance optimization part of your development cycle. Regularly review metrics and implement improvements during updates and releases to ensure ongoing optimization as your site evolves.
By following these recommendations, as a Shopify store owner, you can consistently enhance your website’s performance and ensure long-term success in terms of both user experience and search engine visibility.
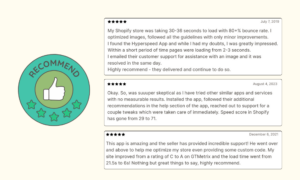
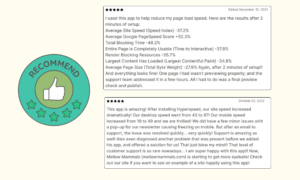
Real Results With Hyperspeed
 |  |
|---|
How fast is your Shopify store?
Compare how fast your store is to a huge sample of other stores. Get benchmarked and find out where you can improve your speed to make more sales.


